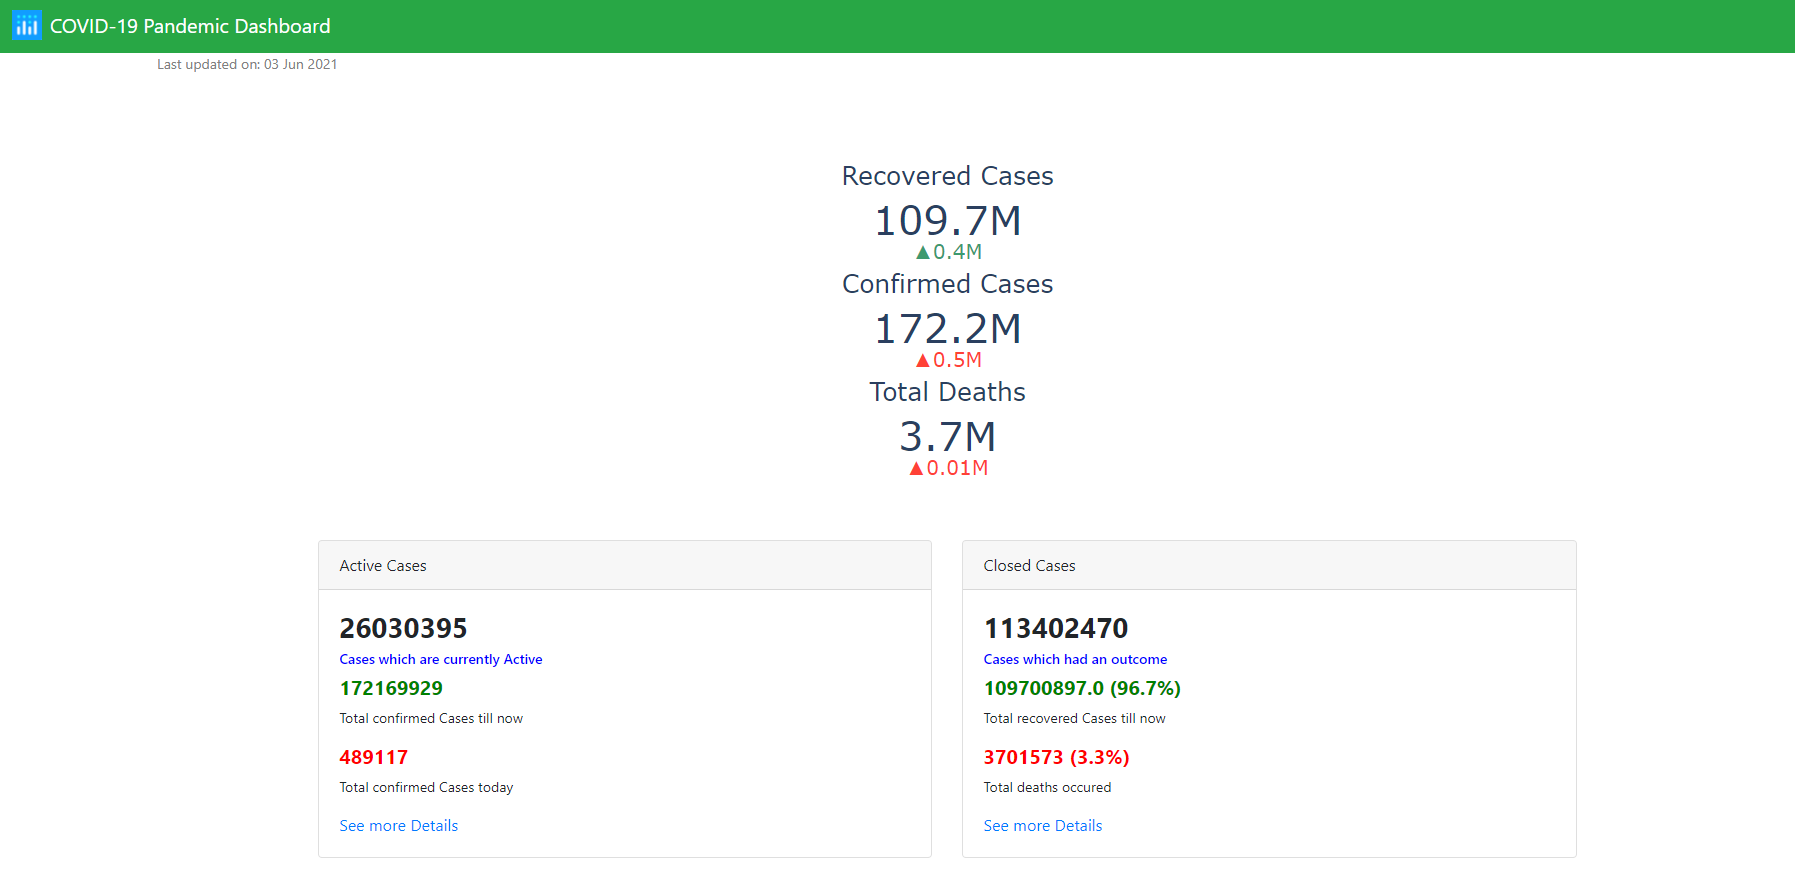
Live Covid-19 Dashboard

This was my first major Data Analytics Project, and it was tailored to suit the current situation on Earth(2020/2021).
The Live Covid 19 Dashboard brings a wide variety of information to your finger tips. The best part is that the information is well upto date.
This Project is a Real time Analytics Dashboard of Time-series Data.
Live Data is obtained from the COVID-19 Data Repository by the Center for Systems Science and Engineering (CSSE) at Johns Hopkins University.
The project can be found at my Github repo: Covid-19-Dashboard.
Technologies:
- - Python
- - Numpy
- - Pandas
- - StreamLit
- - Dash Framework
- - Plotly library
Landing View
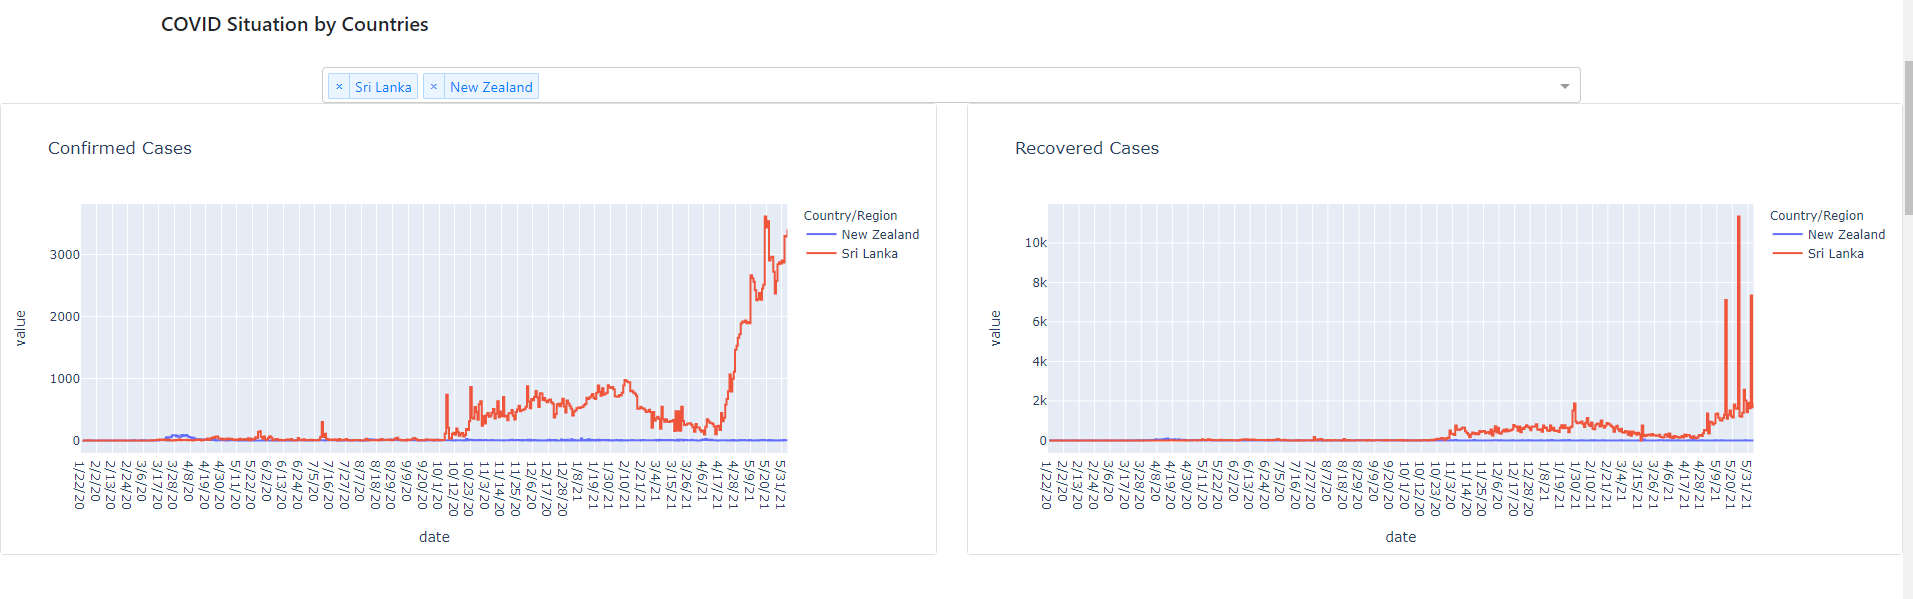
Confirmed and Recovered Cases by Countries
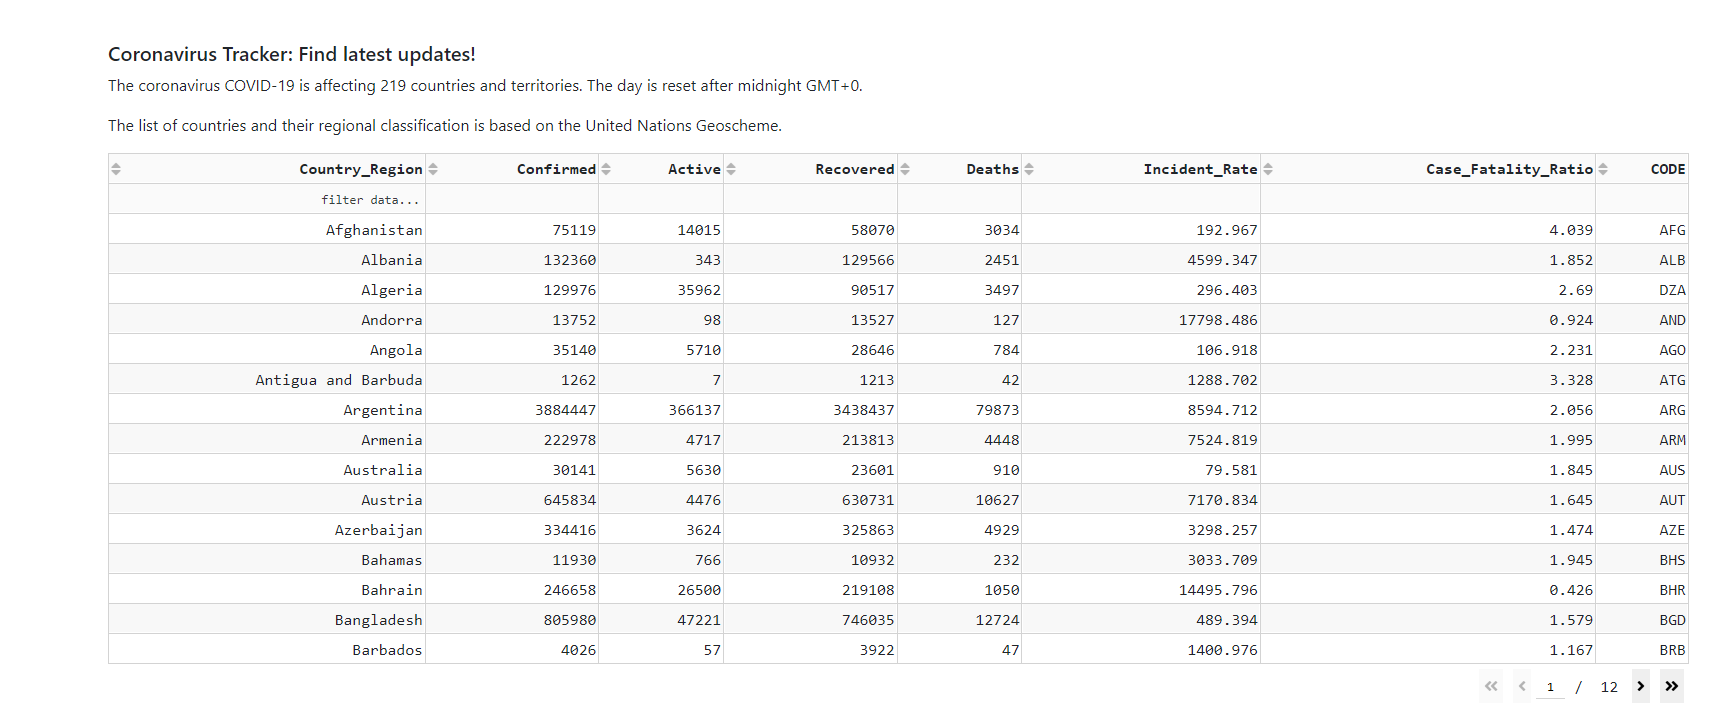
Live Data Table
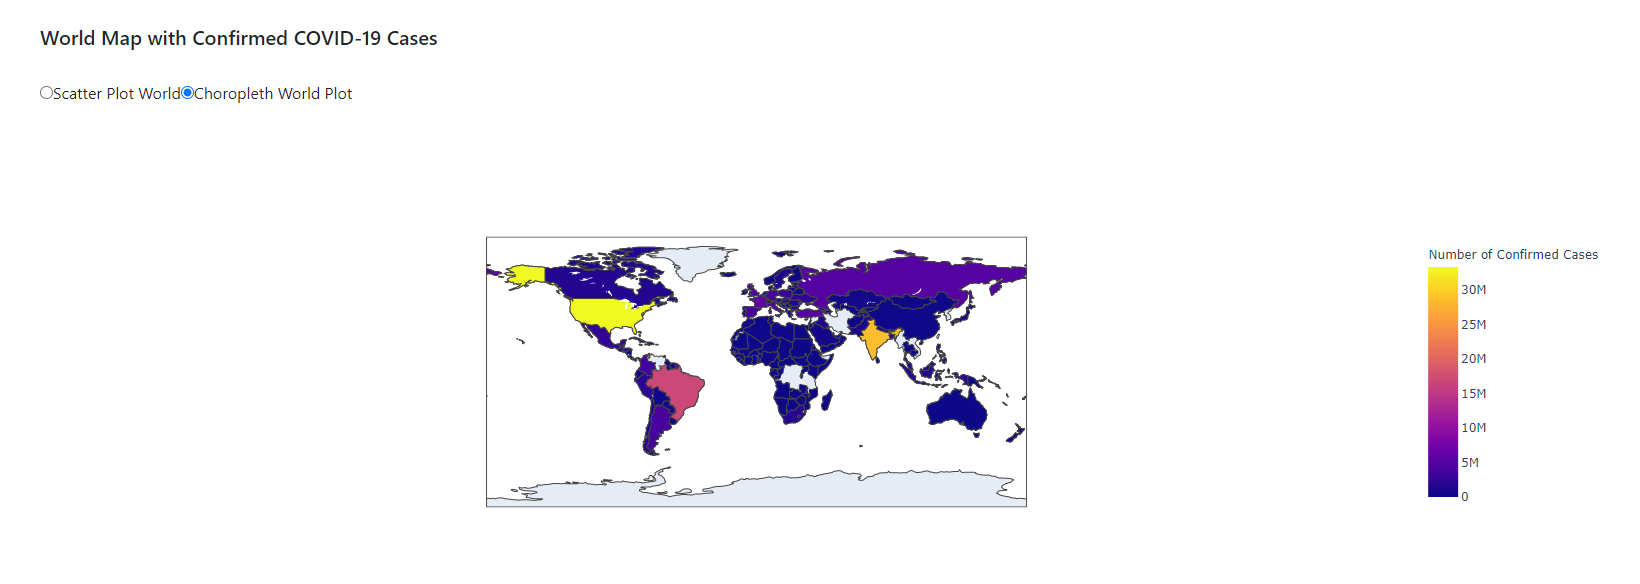
The World Map showing the Spread
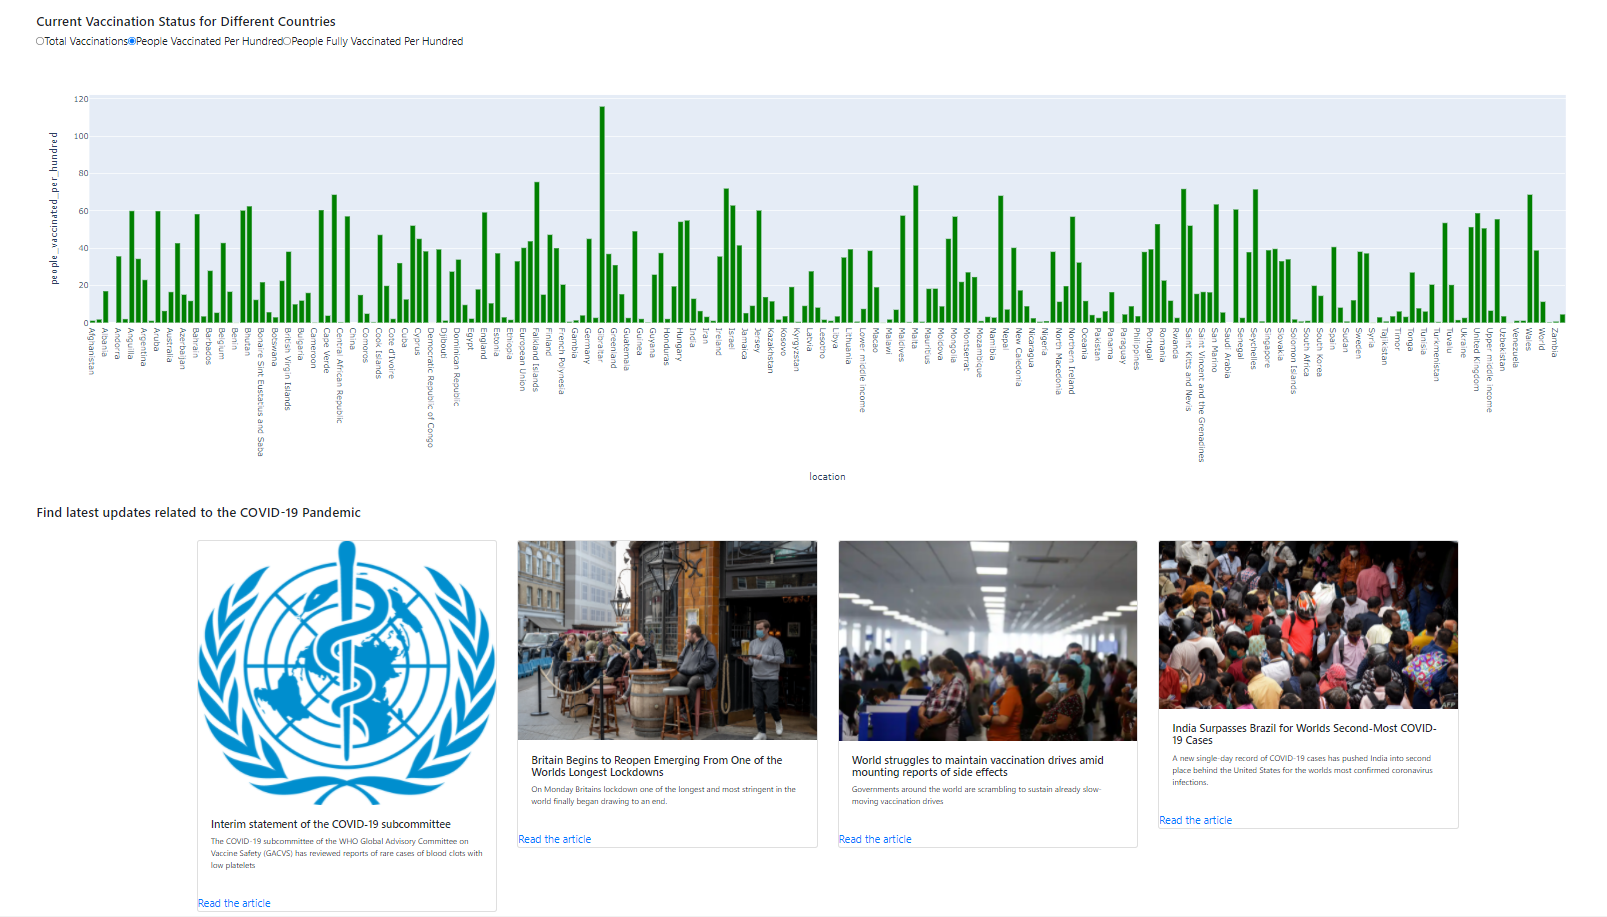
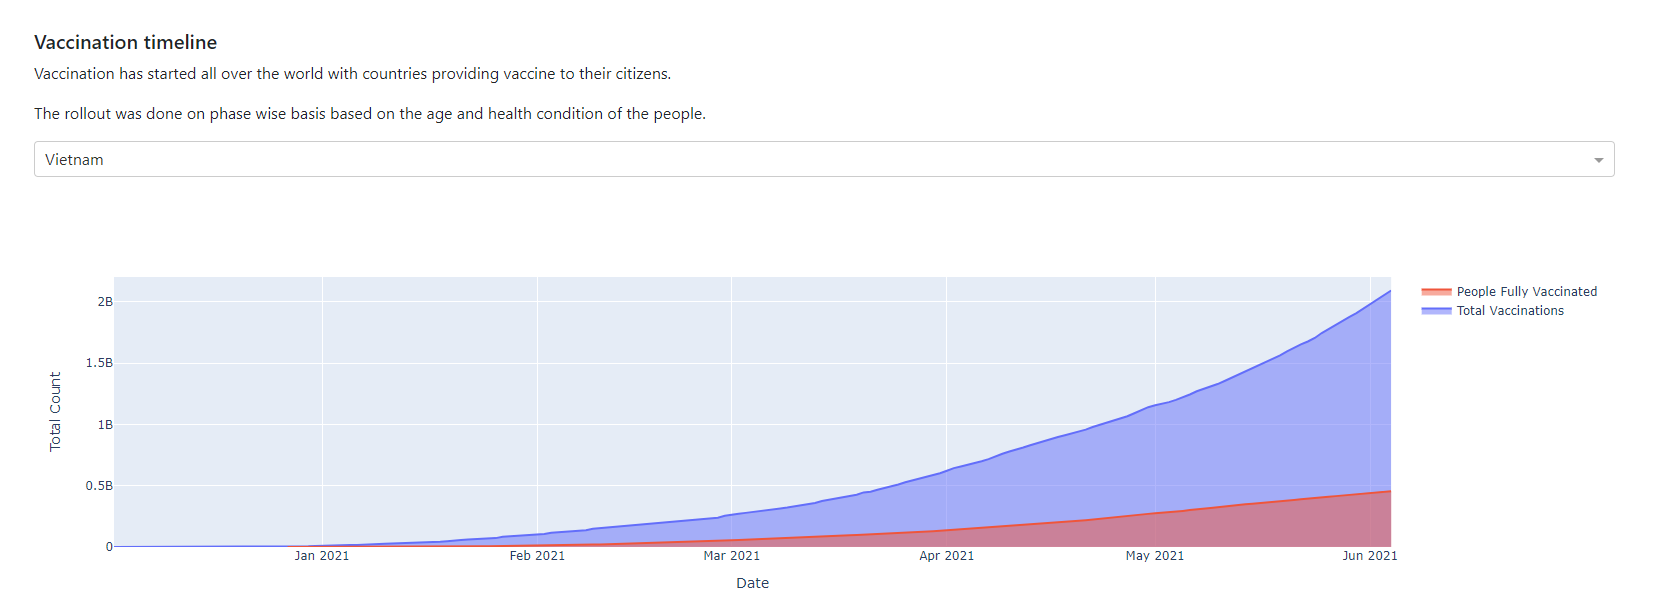
Vaccination Timeline
Vaccination Status along with Latest News